This article explains how Pinpoint can be used to help identify whether parts of your heat network are performing well or not
A poorly performing network will lead to higher heat losses, higher costs for customers, and higher carbon emissions. Keeping on top of performance data minimises operating costs for your heat network. Guru Pinpoint displays heat network performance data in digestible charts and dashboards helping you to spot problems and identify trends.
When analysing your network data you will be able to explore in real-time to assess where the problem may be. Is it a handful of dwellings across the network that may not have been commissioned correctly? Or maybe there is just one block where a bypass has been left open?
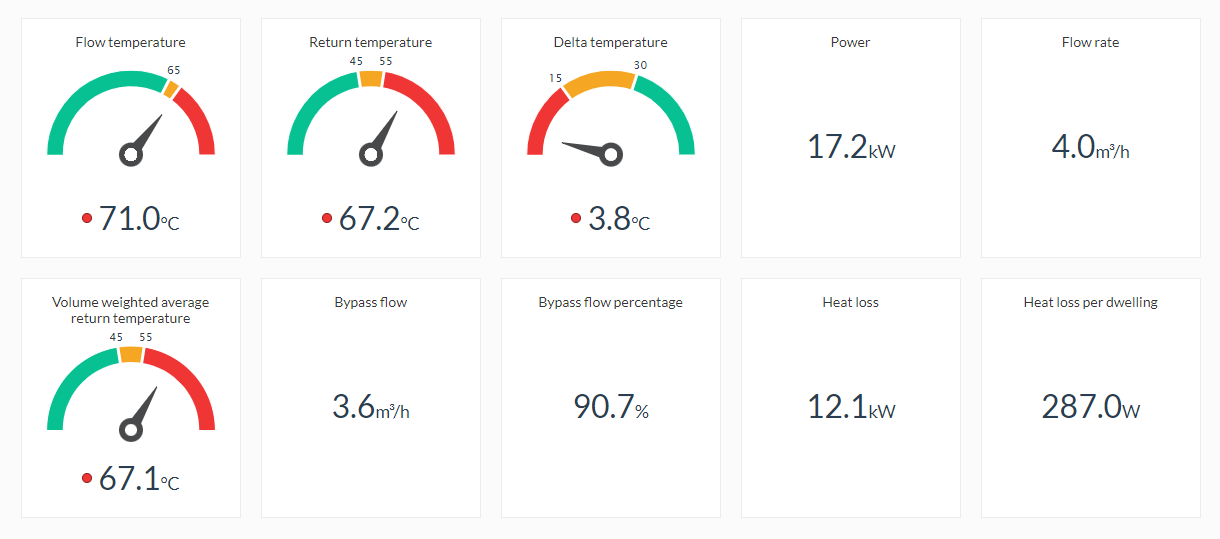
Below is the perfect example of a poorly performing heat network. Using Guru Pinpoint’s dashboard we are able to quickly see that something isn’t right using the traffic light system. Flow temperature, return temperature and Delta T are all coded in red, heat loss per dwelling is high, as are the bypass flow rates.
From here, we can view a list of dwellings on this network, ordering by Overall VWART to identify poorly performing dwellings before taking a closer look at time series data.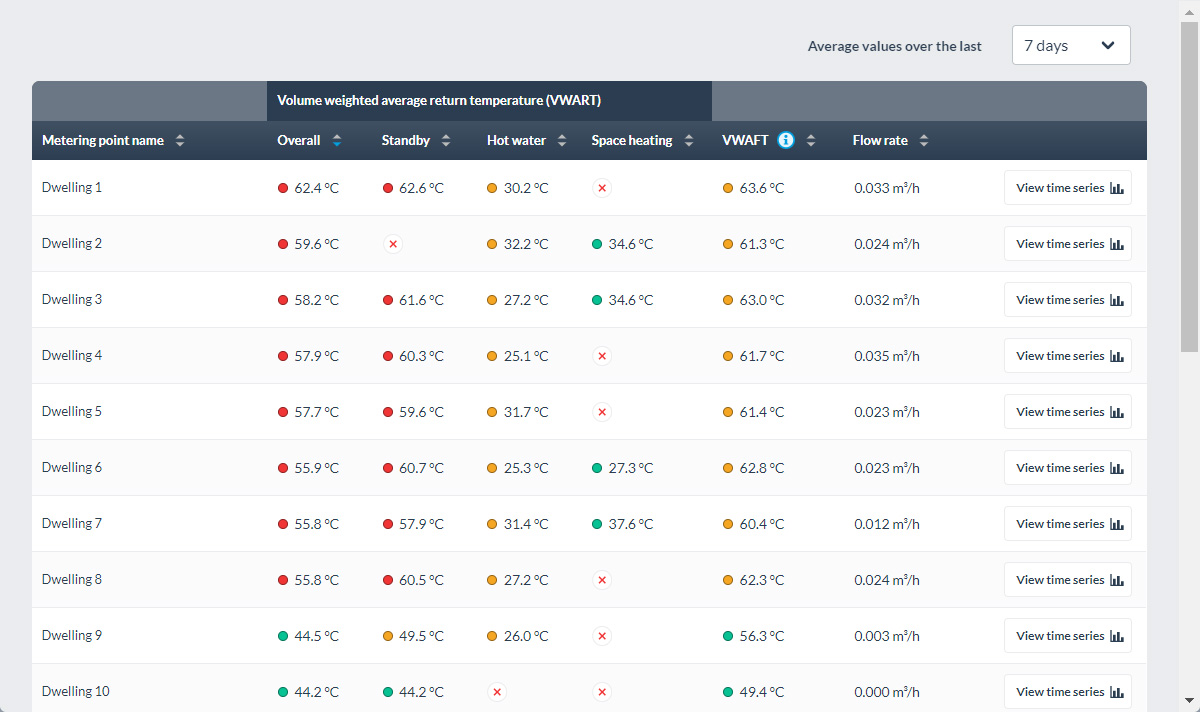
If we then look more closely at one of the dwellings on this network, we can see a similar pattern here too: Tightly coupled flow and return temperatures with a consistently high flow rate regardless of whether heat is being demanded or not. This tells us that interventions need to be made at the dwelling level, not just in the plant room.
Next, we have an example where dashboards can be used to help understand how different parts of the heat network are performing. The following two dashboards are from two different blocks on the same heat network – with data coming from the bulk meters from each block.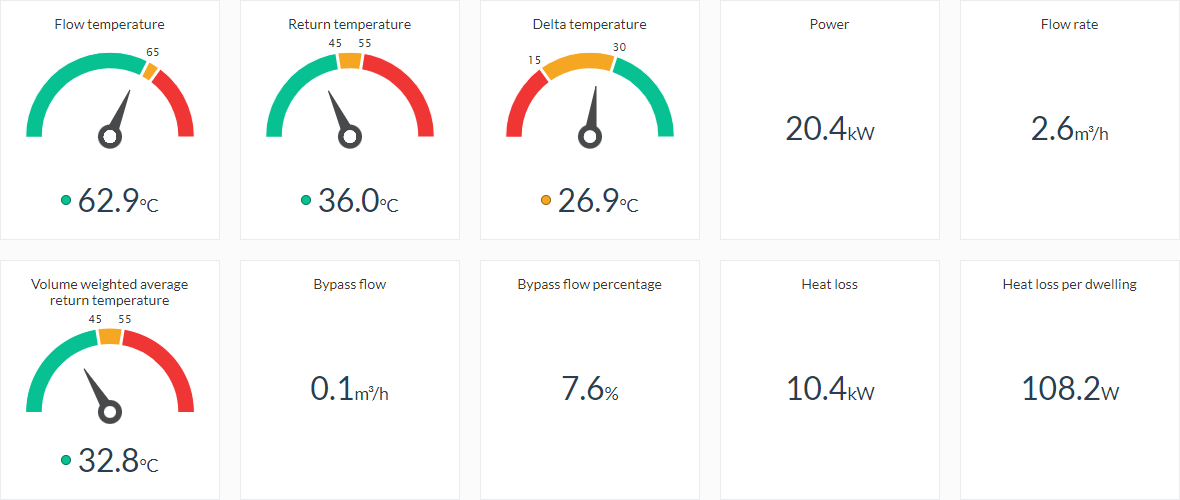
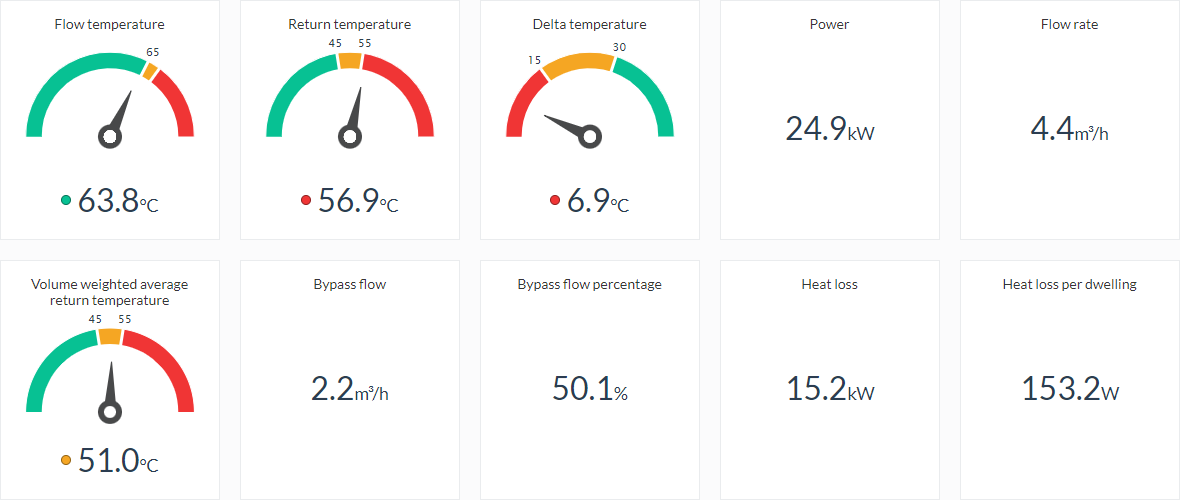
Whereas the adjacent block has a DeltaT of only 7 degrees and heat losses are about 50% higher than the first block. Here there appear to be one or more open bypasses on the block, with around half of the water pumped around the circuit coming back through a bypass rather than through an HIU. This is likely to be a commissioning issue.
By continuously monitoring your heat network performance, you can reduce call-outs, keep your operating costs low, and identify common heat network problems including HIU faults, open bypasses, and commissioning errors.